
To build the tip, we needed to make the protein parts that form the complex. Here, we describe how we cloned and produced tip proteins from the bacteria Yersinia pestis (LcrV) and Salmonella typhimurium (SipD) that were engineered to stick specifically to our artificial DNA construction scaffold.
Coding Sequences for LcrV and SipD were ordered as gBLOCKs (IDT) to an expression vector using Gibson assembly and the assembly products were transformed into NEB DH5α competent E. coli (High efficiency). Colonies were screened for the presence of the insert by colony PCR and gel electrophoresis (insert length ~1.3kbp). Successful clones were used to inoculate 50mL LB broth and incubated overnight for MiniPreps (Qiagen) Plasmid purification.
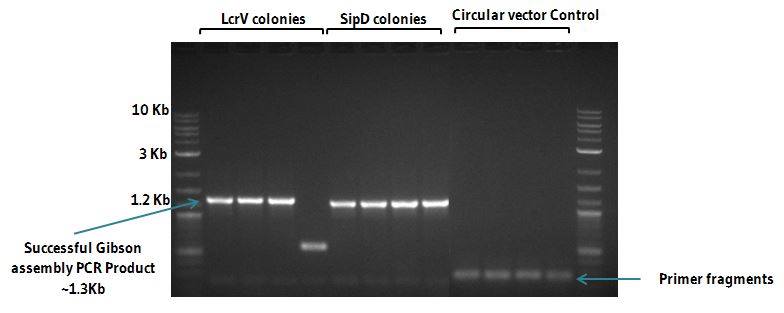
Figure 1. Gel of tip protein PCR product after gibson assembly.
T7 expression plasmids were transformed into T7 high expression E. coli and protein expression was induced with IPTG. Samples from different stages of our protein expression and Imobilised Metal Ion Chromatography (IMAC) purification pipeline were collected for running SDS-PAGE (Figures 2 and 3). The major band corresponded to the expected molecular weights (SipD and LcrV: 39kDa) along with minor bands from contaminants. Protein content of the elutions was quantified by Direct Detect (Millipore) Infrared spectroscopy (SipD: 2.0mg/mL, LcrV: ~12mg/mL).
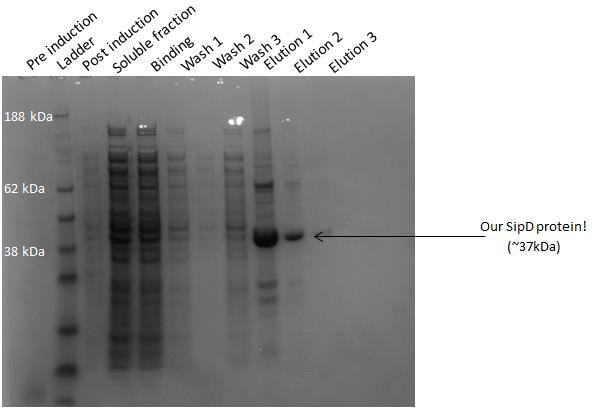
Figure 3. SDS-PAGE of SipD at different stages of protein expression.
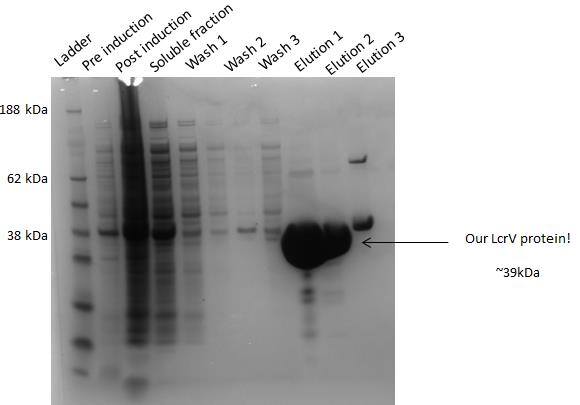
Figure 2. SDS-PAGE of LcrV at different stages of protein expression.
To confirm that we had indeed purified our target proteins, the major bands from SDS PAGE were extracted from gels and submitted to tandem mass spectroscopy (Bio analytical Mass Spectrometry Facility at UNSW Australia). Spectra were analysed using the MASCOT Peptide Mass Fingerprint algorithm (MATRIX Science) with SipD and V-antigen tip protein as the primary hits.
Elution fractions from IMAC purification were combined and further purified by Size Exclusion Chomatography (SEC). Chromatographs of absorbance at 280 nm reveal that LcrV elutions are largely monodispersed (Figure 4). In contrast about 50% of SipD protein was aggregated, eluted in the void volume of the column. However, most of the remaining protein appeared to be mono-dispersed (Figure 5)..
Figure 4. SEC chromatogram for LcrV protein.
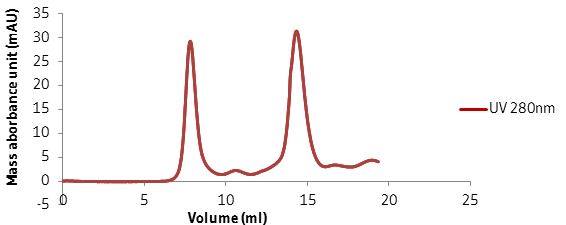
Figure 5. SEC chromatogram for SipD protein.
A gBLOCK sequence was ordered from IDT for a LcrV and SipD mutant with an accessible cysteine at the carboxyl terminal. The Gibson assembly reaction and protein expression was successful for the LcrV mutant, but cloning was not successful for the SipD mutant. After expressing the LcrV protein, the C-terminal cysteine was labelled with a maleimide Alexa488 fluorophore dye for the purpose of single molecule fluorescence microscopy. Figure 6 is a chromatogram which illustrates our mono-dispersed Alexa488 labelled LcrV protein being eluted at ~15ml. Figure 7 is a SDS-PAGE gel of our LcrV mutants’ post-SEC and it protein concentration was determined to be ~ 0.025g. Figure 8 illustrates the same gel being excited at the wavelength of 495nm to observe the presence of Alexa488 fluorophore dye labelled LcrV proteins.
Figure 6. SEC chromatogram for Alexa488 fluor dye labelled LcrV protein.
Figure 7. SDS-PAGE gel of LcrV cysteine mutant
Figure 8. SDS-PAGE gel of LcrV cysteine mutant exited at 495nm emission expression.
We've cloned, expressed, and purified two T3SS Needle Tip protein monomers, confirmed their identity through tanedem mass spectroscopy, and fluorescently labeled one of them..
A SspI digest mix was prepared using the recipe outlined the table 1.1.1 and the reaction was carried out using the conditions stated in table 1.1.2.
Table 1.1.1 SspI digest reaction mix components
Component |
Volume (µl)/ reaction |
Final Concentration |
Circular LIC_HK vector | 5 | ~ 1ug/reaction |
| NEB buffer | 5 | 1x | SspI enzyme | 1 | 10 units | MiliQ water | 39 | - | Total volume | 50 | - |
Table 1.1.2. SspI digest reaction conditions
Step |
Length of time (minutes) |
Temperature (°C) |
Incubation | 30 | 37 |
| NEB buffer | 5 | 1x | Heat Inactivation | 20 | 65 |
Agarose was dissolved to a final concentration of 1% (w/v) in 1x TAE (Biorad) and pre-stained with a drop of RedsafeTM nucleic acid staining solution. The samples were mixed with New Englands Biolabs 6x Gel loading dye and undergone electrophoresis for approximately 30 minutes at 120V. The gel was visualised under UV light post electrophoresis.
After performing the vector SspI digest reaction, a Gibson assembly reaction mix was made (Table 1.2.1) and incubated at 50 °C for 30 minute.
Table 1.3.1 Gibson Assembly reaction mix
Component |
Volume (µl)/ reaction |
Final Concentration |
gBLOCK insert | 1 | 100fmol |
| Digested vector | 4 | ~ 50ug | Heat Inactivation | 20 | 65 | Gibson Master Mixn | 5 | 1x | Total volume | 10 | - |
2µl of the Gibson Assembly reaction mix (Table 1.3.1) was cloned into 25µl of NEB DH5α competent E. coli (High efficiency) by heat shocking at 42 °C for 45 seconds. 100 µl of NEB SOC Outgrowth medium was added to the transformed cells and incubated at 37 °C for approximately an hour. The transformed cells were spread onto Luria Broth (LB) agar containing kanamycin (final concentration of 37µg/ µl) and incubated at 37°C overnight.
Single colonies from 1.4 was picked and diluted in 50 µl of MiliQ water. A master mix (table 1.4.1) was prepared and a PCR reaction was carried out on Applied Biosystems Veriti Ⓡ 96-well Thermal Cycler using the conditions outlined in table 1.4.2. Once the PCR reaction has been completed, gel electrophoresis was performed.
Table 1.5.1 Colony PCR master mix
Component |
Volume (µl)/ reaction |
Final Concentration |
GoTaq® Green Master Mix | 1 | 1x |
| T7 forward primer | 2.5 | 1µM | T7 Reverse primer | 2.5 | 1µM | Picked Colony | 2.5 | - | MiliQ water | 5 | - | Total volume | 25 | - |
Table 1.5.2 Colony PCR reaction conditions
Step |
Length of time |
Temperature (°C) |
PCR activation step | 30 seconds | 98 |
| Three step cycling: 40 cycles | Denaturation | 10 seconds | 98 | Annealing | 30 seconds | 55 | Extension | 1 minute | 72 | Final Extension | 10 minutes | 72 |
A single positive colony from 1.4 was inoculated into 10ml of LB media and incubated at 37 °C overnight. On the following day, once the OD600nm of the culture has reached ~ 1 plasmid DNA purification was performed using the QIAGEN® Plasmid Purification kit.
After we have successfully made our genetic constructs, these can be cloned into T7 E. coli bacteria so they can mass produce our proteins!
2µl of the purified plasmid (section 2.1) was transformed into 25µl of T7 high expression E. coli cells via heat shocking at 42°C for 45 seconds. 100 µl of NEB SOC Outgrowth medium was added to the transformed cells and incubated at 37 °C for approximately an hour. The transformed T7 cells were spread onto Luria Broth (LB) agar containing kanamycin (final concentration of 37µg/ µl) and incubated at 37°C overnight.
A starter culture was created by inoculating a single colony of T7 E. coli into 20ml of LB media with kanamycin (final concentration of 37µg/ µl). This starter culture was incubated at 37°C until it reached an OD600 > 1.
12 x 1 Litre of LB media was prepared: each litre contains 1 drop of antifoam and a final concentration of 37 µg/ µl Kanamycin. 1ml of the starter culture (section 2.3) was inoculated per litre of LB media and incubated (37°C, 150rpm); the OD600nm was measured every hour until it reached mid-log phase (0.4-0.6).
Once the cultures has reached mid-log phase, a sample was collected for SDS-PAGE. IPTG was added (0.5mM final concentration) to the culture to induce gene expression and incubated (18°C, 150rpm) overnight.
On the following day, the OD600nm of the induced cultures were recorded and a sample was collected for SDS-PAGE. The cultures undergone centrifugation (4000g, 20minutes) to pellet the cells and the supernatant was removed. The cell pellet was resuspended in 1ml of lysis buffer (table 2.5.1) per OD 600nm per 100ml of culture.
For example:

To obtain the cell lysates, the resuspended mixture was sonicated on the Branson Digital Sonifier using the following settings: 10 minutes at 20% amplitude, 1 second on and 1 second off. The cell lysates were ultracentrifuged (13,000g, 30 minutes) to attain the soluble fraction which was then decanted into 15ml falcon tubes. A sample of the cell lysate and soluble fraction was collected for SDS-PAGE.
Table 2.4 lysis buffer recipe mix
Component |
Final Concentration |
| Tris-HCI (pH=8) | 20mM |
| NaCI | 150mM | EDTA- free Protease inhibitor | 1 tablet | DNAase | A dip |
After we have extracted our protein from the bacteria, we now have to purify it! We aim to do this using histidine tag affinity chromatography and size exclusion chromatography
1ml Profinity TM IMAC Ni-Charged resin was transferred into a gravity column; the resin and column was washed with three column volumes of MiliQ water and equilibrated with three column volumes of Wash Buffer (table 3.1.1). After the equilibration step, the soluble fraction was transferred into the gravity column and incubated on a slow rotor for ~2 hours at 4°C. Once the incubation step has completed, unbounded material was collected in the flow through and washed with three column volumes of Wash Buffer. Samples of unbounded and washed material were collected for SDS-PAGE.
The proteins were subsequently eluted with three column volumes of the elution buffer (table 3.1.2) and samples were also collected for SDS-PAGE. The eluted proteins were concentrated to ~ 2mg/ml via centrifugation (2000g, 5 minutes) in a 10,000 MW membrane concentrator. This concentrated sample will be used for Size Exclusion Chromatography.
Table 3.1.1 Wash buffer recipe mix
Component |
Final Concentration |
| Tris-HCI (pH=8) | 20mM |
| NaCI | 150mM | EDTA- free Protease inhibitor | 1 tablet | Imidazole | 20mM |
Table 3.1.2 Elution buffer recipe mix
Component |
Final Concentration |
| Tris-HCI (pH=8) | 20mM |
| NaCI | 150mM | EDTA- free Protease inhibitor | 1 tablet | Imidazole | 500mM |
Size exclusion chromatography was performed using the Superdex 200 10/300 GL column. The column was equilibrated with the SEC buffer (table 3.2.1) at a flow rate of 0.5ml/minute for an hour. Approximately 500µl of the concentrated protein (section 3.1) was loaded and purified using the conditions as described in table 3.2.2.
Table 3.2.1 SEC buffer recipe mix
Component |
Final Concentration |
| Tris-HCI (pH=8) | 20mM |
| NaCI | 150mM | EDTA- free Protease inhibitor | 1 tablet |
Table 3.2.2 Conditions used for SEC on Superdex 200 10/300 GL column
Parameters |
Value |
| Flow rate | 0.5ml/minutes |
| Maximum Pressure | 1.5 MPa | Method / Run length | 1.25 column volumes |
Samples collected from the different steps of protein expression and purification were mixed with NuPAGE LDS sample buffer (4X) and loaded onto a NuPAGE 4-12% Bis-Tris gel. Electrophoresis was performed at 200 Volts for 30 minutes. The gel was stained with SimplyBlueTM SafeStain for an hour post electrophoresis and de-stained with MiliQ water overnight. The gel was visualised under visual light
400µl of 50% slurry of Profinity TM IMAC Ni-Charged resin was equilibrated with 3x3 column volumes of lysis buffer (Table 2.5.1).
Following from the protein harvest (section 2.5) using the LcrV_Cysteine mutants, the equilibrated 50% slurry along with other components were added to the soluble fraction within a 15ml falcon tube as detailed in table 4.1.1. Once added, the soluble were incubated on a slow rotor at 4°C for ~2 hours.
Table 4.1.1 Components added to LcrV_Cysteine mutant soluble fraction
Component |
Final Concentration |
| TCEP | 200µM |
| Imidazole | 10mM | Equilibrated Ni-Charged resin | 400µl (50%) |
After this incubation step, the soluble fraction was transferred into Micro Bio-Spin® Chromatography Columns and washed with 20 column volumes of Wash Buffer (Table 4.1.1) along with five column volumes of rinse buffer (Table 4.1.2). The Ni-charged resin was resuspended to 50% slurry with the rinse buffer and protein concentration was quantified via SDS-PAGE (section 3.3) against known concentrations of BSA.
Table 4.1.2 Rinse buffer recipe mix
Component |
Final Concentration |
| Tris-HCI (pH=8) | 20mM |
| Imidazole | 10mM | NaCI | 300mM |
In an Eppendorf tube, the 50% slurry was incubated with TCEP (200µM) at room temperature for 30 minutes and 5X molar excess of Alexa Fluor® 488 dye was added. This mixture was covered in aluminium foil and incubated at 4°C overnight.
After the incubation, the resin was transferred to a Chromatography Column and washed with 20 column volumes of Wash Buffer (Table 3.1.1) for the removal of unbound excess fluorophores. The labelled proteins were then eluted in 3 x column volume fractions using the elution buffer (Table 3.1.2).
SEC was performed as outlined in section 3.2 to separate remaining excess fluorophore from the labelled protein. Monomeric protein concentration was quantified on SDS-PAGE (section 3.3) against known concentrations of BSA while concentration of labelled protein was determined via UV-visible scan on the NanoDrop 1000 Spectrophometer (1mm path length).
The labelling efficiency was calculated using the formula:

Ax=absorbance value of dye at absorption maximum wavelength.E dye= extinction coefficient of the dye or reagent at the absorption maximum wavelength
10% glycerol was added to the pure fractions of the labelled protein, snap-freeze in liquid nitrogen and stored at -80°C. The labelled proteins will be used for Single molecule fluorescent microscopy.